Nancy Wirsig McClure shares her design expertise by making presentations at events. Get in touch if you might want a custom talk for your group on infographics, explanatory animation or user interface design.
[hr]
STC (Society for Technical Communication) Willamette Valley Chapter
January, 2014 • Portland
Presented “Visual Thinking and Visual Storytelling”
You don’t have to be artist to make good use of visuals.
First, we talked about visual thinking — the use of sketching and storyboards during the development of communications and interfaces. This is a collection of techniques that can help your idea generation and internal communication. If you can draw a stick figure, you can use visual thinking.
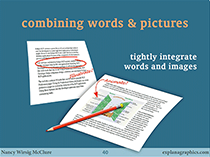
Second, we talked about visual storytelling — how to make sure your team contemplates the use of visuals in what they produce. We examined ways to approach everything visual — from simple page layout techniques, through screen captures, photographs and video, to illustration and animation.
The Digital Marketing Conference
June 18 – 19, 2013 • Portland
Presented “Infographics for increased engagement and sharing”
Nancy’s talk was one of several 5-minute presentations (following the Ignite format) at the opening event.
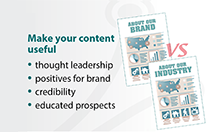
Are you hoping to post content that gets shared often? Visual content is shared more often than text, and infographics are shared even more! An examination of how to identify content that could become infographics or charts, and how to make a good infographic, with examples.
See Nancy’s follow-up page with resources on these topics.
TechIgnite TAO! v4 (Technology Association of Oregon)

May 16, 2013 • Portland
Presented “Fingerprints Everywhere: Planning for Touch User Interfaces”
Nancy’s talk was one of twenty 5-minute presentations on various technical topics, in an evening that followed the Ignite format, sponsored by the Technology Association of Oregon.
Software creators need to change their thinking to design and develop for touch, which is not just for mobile or small screens any more. Discoverability is key. Provide animation, just-in-time prompts, and visual design that suggests actions — especially when the content is the interface.
 STC (Society for Technical Communication) Willamette Valley Chapter
April 18, 2013 • Portland
Presented “Information Becomes Experience via Motion Graphics”
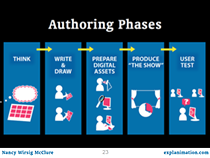
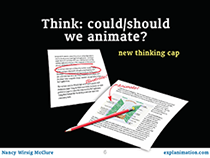
There’s a role for animation in improving the comprehension of complex information by animating diagrams, charts and graphs, narratives, and technical illustrations. Covers the decision to add motion to a topic, creation of satisfying and useful effects, and development steps like storyboards. Also, the basics of how to use animation software, technology and software choices, examples for inspiration.
 WritersUA Annual Conference
March 7-8, 2013 • Seattle
Presented “Explanatory Animation”
An overview of a project created in Adobe AfterEffects and published on YouTube, and a discussion of a role for motion graphics beyond screencasts — improving the comprehension of complex information by animating diagrams, charts and graphs, narratives, and technical illustrations.
 Ignite TAO! v3 (Technology Association of Oregon)
September 2012 • Portland
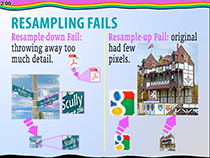
Presented “A Magical Pixelry Tour”
A fast-paced technical talk about bitmap image resolution, scaling vs resampling, compression vs quality, and PNG vs JPG vs GIF. Intended for geeks using digital cameras and image sharing, as well as for coders and creators of icons & interface elements.
 Ignite SAO! v2 (Software Association of Oregon)
March 2012 • Portland
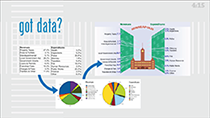
Presented: “Tell Your Tech Story Visually”
Using infographics and diagrams to succinctly explain technical concepts and business cases. Maximizing the limited attention you get from customers and investors, and increasing the memorability of your key ideas.
 eLearning DevCon
June 2010 • Salt Lake City
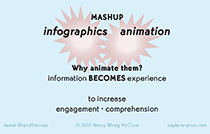
Presented “Enhancing Infographics & Diagrams with Animation”
The mashup of animation with infographics and diagrams lets you turn information into experiences, increasing comprehension and retention. Topics: how to use the dimension of time effectively; steps in developing motion graphics. Many examples and discussion of how they demonstrate best practices.
Leave a Reply