“Infographics for increased engagement & sharing”
an Ignite talk by Nancy Wirsig McClure
Claims for the shareability of infographics
An infographic with data on infographics popularity (scroll down)
Another infographic with data on infographics popularity (I’m not sure about the validity of all their sources)
What Kind of Content Gets Links in 2012?
Additional Resources: Conceiving and executing infographics
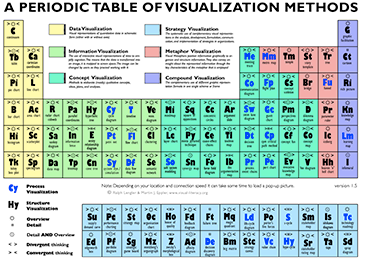 Types of visualizations: an interactive diagram … Visit the site and roll your cursor over a type (which only works on non-touch devices!) and see an example pop-up. This merits close study because the rows and columns show the relevance of different visualization types.
Courses on lynda.com ($25/month unlimited access to online video courses)
- Infographics: Visualizing Relationships … 50-minute walkthrough of conceptualizing and drawing a diagram of many-to-many relationships between entities (a.k.a. a network graph as a radial chart)
- Infographics: Planning and Wireframing … 40-minute walkthrough of several example infoogrampics – a few with a brief discussion of choices made, and how one was developed from idea through layout.
- Creating Infographics with Illustrator …Mordy Golding brilliantly distills basic ideas for approaching an infographic in 20 minutes, followed by 4 hours of Adobe Illustrator step-by-step.
Additional Resources: What makes a quality infographic?
The Do’s And Don’ts Of Infographic Design (Smashing Magazine 2011)… A Seattle infographics design agency suggests ways to use visuals to make numbers look snazzy. I personally dislike almost all these examples.
The Do’s And Don’ts Of Infographic Design [Revisited] (Smashing Magazine 2011)… A long-time, published visualization expert suggests avoiding all that “decor” and use visuals to clarify. Oh yeah.
A teacher’s rubric for evaluating students’ infographics projects … useful for any of us!
How to Graph Badly … a dry-looking academic paper, but nice content.
The Top 10 Worst Infographics Ever Created … Some mistakes to avoid.
Leave a Reply